
A holistic introduction for the beginner
When I first started working with Prometheus, I quickly realized it wasn’t the easiest tool to get into. The documentation felt fragmented, the terminology was unfamiliar, and understanding how all the pieces fit together was far from obvious. If you’ve ever felt the same, you’re not alone. That’s exactly why I wrote this guide — to give newcomers a clearer path into the Prometheus ecosystem, based on real-world experience.
This article is intended as an introduction to the Prometheus ecosystem, primarily for those new to the solution. By “ecosystem,” I refer not only to components within the Prometheus project but also to related tools and integrations that work alongside Prometheus.
What is Prometheus?
Prometheus is an open-source monitoring and alerting system originally developed at SoundCloud and now a part of the Cloud Native Computing Foundation (CNCF). Prometheus is designed for reliability and scalability, making it a preferred choice for monitoring cloud-native applications, microservices, and containerized environments. However, it is equally effective in traditional IT infrastructures.
The primary goal of Prometheus is to collect, store, and query time-series data efficiently, providing insights into system performance, health, and availability. It is optimized for operational monitoring, performance analysis, and alerting, also suitable for distributed systems where dynamic service discovery is required.
Basic Features of Prometheus
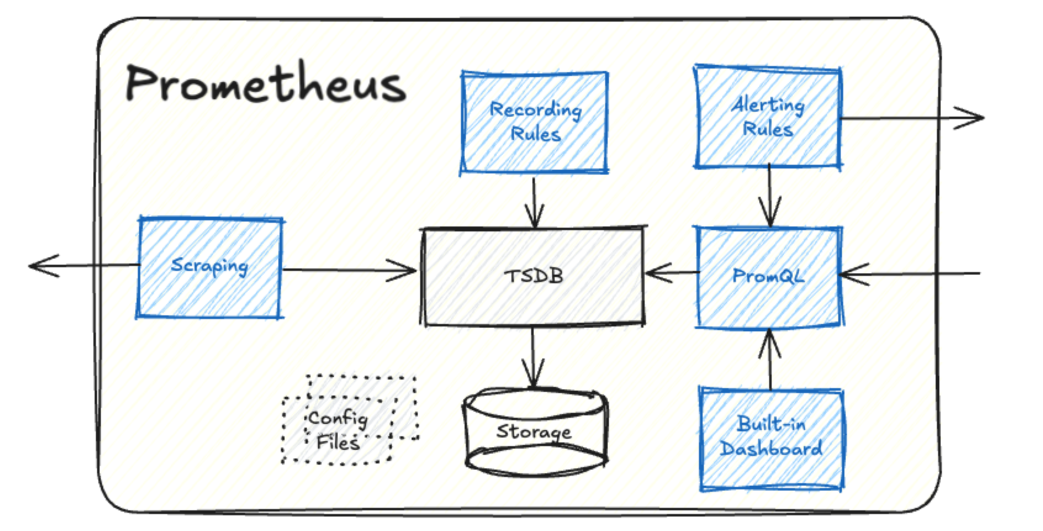
Scraping
Prometheus scrapes (pulls) metrics from configured targets at specified intervals, as defined in its configuration file.
Rules (aka. Recording Rules).
Recording rules precompute and aggregate data, allowing for more efficient querying and storage.
They are defined in a configuration file, using PromQL, then evaulated at a regular interval (e.g. 1 m.)
Alerting
Alerting rules are defined in a configuration file, using PromQL, then evaulated at a regular interval (e.g. 15 s.). An alert is triggered when the conditions in an alerting rule are met. When this happens, Prometheus notifies Alertmanager via an HTTP request.
TSDB/Storing
A built-in time-series database (TSDB) optimized for high write and read performance. This is where all collected metrics are stored. Each metric consists of the following components:
Metric Name: Identifies the measured quantity.
Labels: Key-value pairs that provide additional context (e.g., instance, job, environment).
Timestamp: The time when the metric was recorded.
Value: The actual numerical value of the metric.
Example:
node_cpu_seconds_total{cpu=”0″,mode=”user”,instance=”server01:9100″,job=”node”} 12567.9 1708790400000
PromQL (Prometheus Query Language)
The domain-specific language used to query Prometheus for the metrics stored in the TSDB.
PromQL is the core of Prometheus, enabling users to extract meaningful insights from collected metrics. It is what you use to get the stored metrics used for dashboarding and alerting, and also to process and filter the raw metrics that are collected. Use your favorite GenAI tool for help!
To query the latest value:
node_cpu_seconds_total{instance=”server01:9100″, job=”node”}
Metric name: node_cpu_seconds_total
Labels (to specify which specific metric to get): instance=”server01:9100″, job=”node
To Query the rate of HTTP requests, over the past 5 minutes:
rate(http_requests_total[5m]{instance=”server01:9100″, job=”node”})
Built-in Dashboard
Prometheus provides a basic web UI for querying metrics and evaluating rules.
Limitations: It is not intended for rich visualization; use other tools for advanced dashboards.
More details: https://prometheus.io/docs/introduction/overview/
Rules details: https://prometheus.io/docs/prometheus/latest/configuration/recording_rules/
Alerting details: https://prometheus.io/docs/prometheus/latest/configuration/alerting_rules/
TSDB details: https://prometheus.io/docs/concepts/data_model/
PromQL details: https://prometheus.io/docs/prometheus/latest/querying/basics/
Prometheus Ecosystem
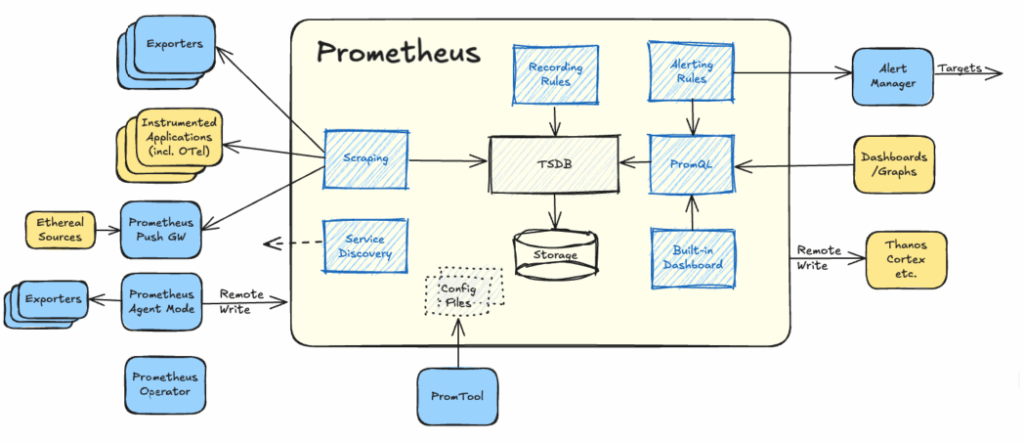
Prometheus Server and Agent
Prometheus Server: The core Prometheus component as described above.
Prometheus Agent: A lightweight mode of Prometheus that only forwards scraped data to remote (central) storage via remote_write without storing it locally. This is typically used when deploying Prometheus at scale.
More details: https://prometheus.io/blog/2021/11/16/agent/
Prometheus Alertmanager
Handles alert notifications from Prometheus and routes them to various receivers (e.g., Slack, email, PagerDuty). Most configuration is done in configuration files. The features are:
Alert Deduplication & Grouping
When Prometheus fires multiple alerts for the same issue, Alertmanager deduplicates them to prevent spam. Alerts can be grouped (e.g., all alerts related to the same service).
Routing & Notification Management
Alerts can be sent to different receivers (email, Slack, PagerDuty, etc.) based on rules.
Routing is defined in a tree-like structure (e.g., database alerts go to the DBA team, infrastructure alerts go to DevOps).
Inhibition (Alert Suppression)
Inhibition prevents unnecessary alerts by suppressing lower-priority alerts if a more severe issue is already occurring (e.g., suppressing instance-level alerts during a global outage).
Silencing Alerts
Users can manually silence specific alerts for a given period.
Useful for maintenance periods or avoiding alert fatigue.
Alertmanager Web UI
supporting the following features:
View Active Alerts
See a list of all active alerts and their statuses (e.g., firing, resolved, silenced).
Alerts display labels, severity, and timestamps.
Manage Silences
Inspect Alert Grouping & Routing
See how alerts are grouped (e.g., by service, severity).
Check which receiver (email, Slack, PagerDuty, etc.) an alert is being sent to.
View Alert History
Check the history of alerts to analyze past incidents.
Debug Alertmanager Configuration
See how alerts flow through Alertmanager.
Useful for troubleshooting routing, silencing, and inhibition issues.
More details: https://prometheus.io/docs/alerting/latest/alertmanager/
Prometheus amtool – Alertmanager CLI Tool
amtool is a command-line utility for interacting with Prometheus Alertmanager. It provides a way to manage, view, and silence alerts without using the web UI. It is bundled with all releases of Alertmanager.
More details: https://github.com/prometheus/alertmanager
Prometheus Scrape Targets
Scrape targets are systems that expose Prometheus metrics in a supported format.
These can either be applications instrumented to do so, or so called Prometheus exporters.
Prometheus Exporters
Exporters act as translators, enabling Prometheus to collect metrics from systems that do not natively support Prometheus format.
There are 100’s of exporters available, covering systems such as DBs, Messaging, HTTP, APIs, HW.
Example: Node Exporter (monitors system metrics like CPU, memory, disk usage).
More details: https://prometheus.io/docs/instrumenting/exporters/
Instrumentation
Prometheus application instrumentation refers to the process of adding metrics collection to your application so that Prometheus can scrape and store relevant performance data. This is typically done using client libraries provided by Prometheus for various programming languages (e.g., Go, Python, Java, and Ruby).
The process generally involves:
Defining and registering metrics – Counters, Gauges, Histograms, and Summaries.
Exposing a /metrics endpoint – This allows Prometheus to scrape the application’s metrics via HTTP.
Using labels – Labels help in categorizing and filtering metrics dynamically.
https://prometheus.io/docs/instrumenting/writing_clientlibs
OpenTelemetry
OpenTelemetry (OTel) is an open-source observability framework under the Cloud Native Computing Foundation (CNCF). It enables applications to collect, process, and export telemetry data (logs, metrics, and traces) for better monitoring and debugging.
Prometheus supports the collection of metrics from Otel sources, and is the recommended choice for this purpose.
https://prometheus.io/docs/guides/opentelemetry
Service Discovery
Automates target discovery, particularly useful in dynamic environments (Kubernetes, EC2, etc.).
When configured to do so, Prometheus will call the SD target for a list of targets to scrape.
Supports static and dynamic configurations.
More details: https://prometheus.io/docs/prometheus/latest/configuration/configuration/#scrape_config
Prometheus Operator
Simplifies Prometheus deployment and management on Kubernetes.
Automates configuration management.
Provides CRDs (Custom Resource Definitions) to manage Prometheus instances, rules, and alerts.
More details: https://github.com/prometheus-operator/prometheus-operator
Prometheus Pushgateway
Allows applications that cannot be scraped to push metrics, for instance ephemeral or batch jobs.
Typically used for jobs that do not run continuously.
More details: https://prometheus.io/docs/practices/pushing/
Promtool
To quickly check whether a rule file is syntactically correct without starting a Prometheus server, you can use Prometheus’s promtool command-line utility tool, for Syntax-checking rules
Getting Started with Prometheus
How do you get started with Prometheus, installing it and try out a simple setup like this?
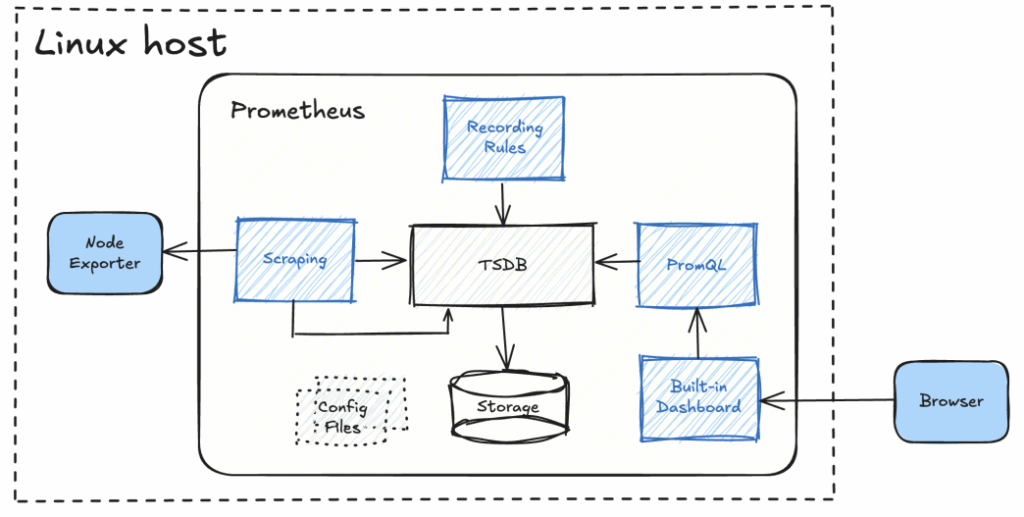
See:
https://prometheus.io/docs/introduction/first_steps
https://prometheus.io/docs/prometheus/latest/getting_started
Conclusion
Prometheus is a powerful monitoring system with an extensive ecosystem designed for cloud-native applications. It provides robust features for metric collection, storage, querying, and alerting.
While Prometheus has strong built-in capabilities, its true potential is realized when integrated with third-party tools, Kubernetes, and various exporters.
This paper has outlined key components and provided references for further exploration. Once you have passed the exploration stage it’s time to learn how to deploy Prometheus at scale. This will be subject for a separate paper.